GrafOverflow
A metric collection script for the Stack Exchange API.
View Some Realtime Stats
Here is a link for you to view some stats in real* time, with one year of history!
*Stats are collected every 5 minutes and are smoothed to a 30 minute average (on a query) to account for API caching.
About
Data is beautiful, so why not draw some beautiful graphs about the sites that helps so many?
This script is based around the carbon-cache metric storage backend and is using Grafana for the UI.
To query the API, I wrote up a Node.js script that will run a collection on a 5 minute interval; this then parses the JSON response from the Stack Exchange API into a format parsable by the metric engine, opens a socket, and sends it.
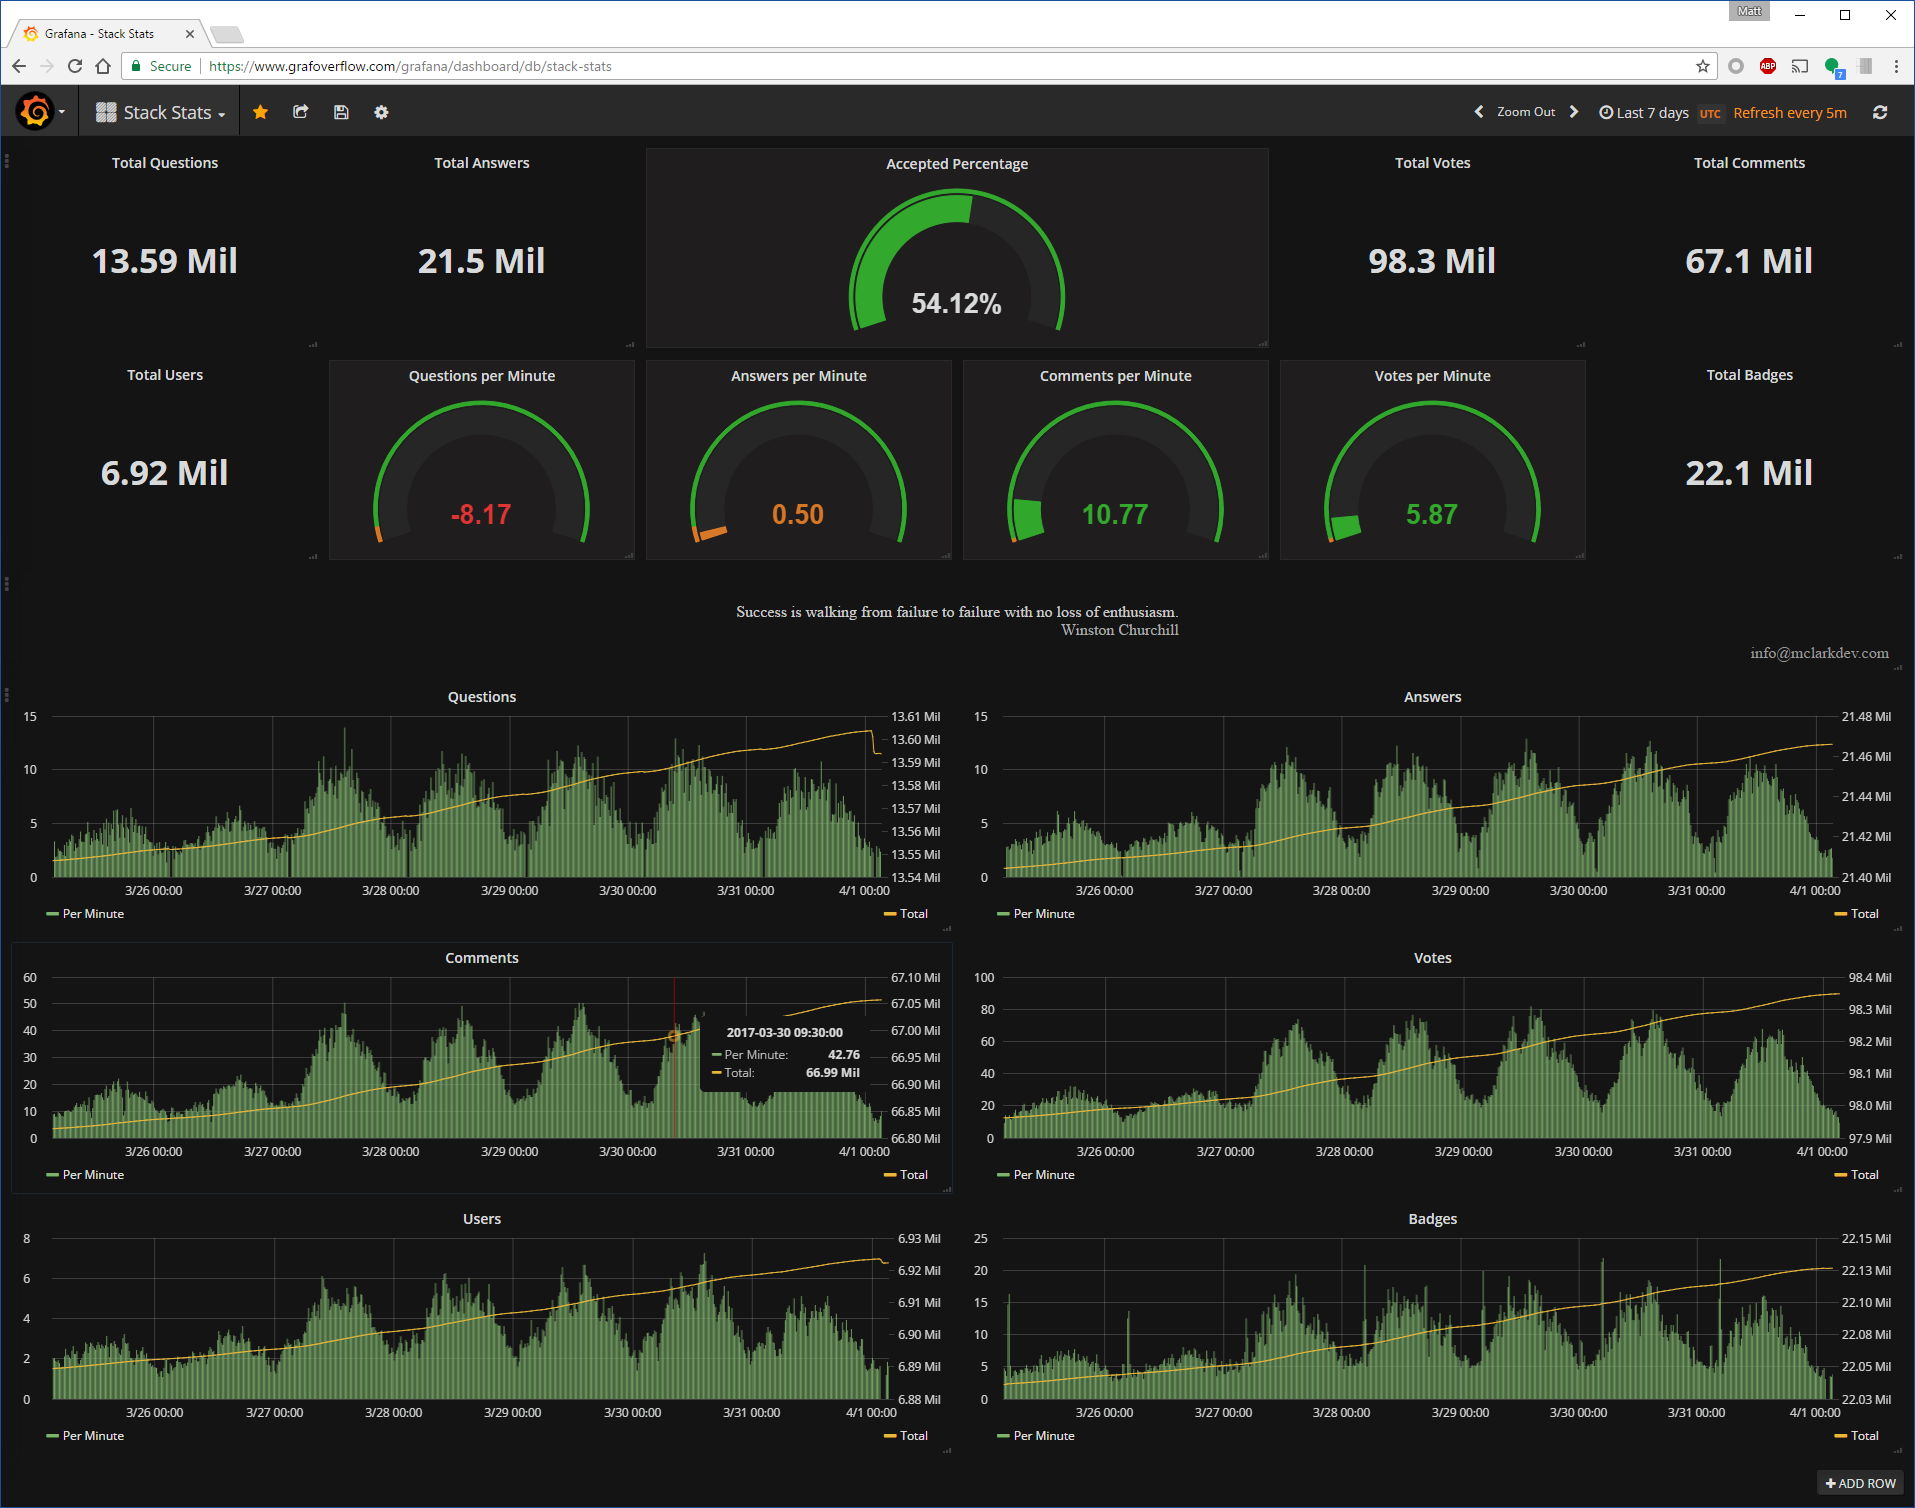
In the above screenshot, you can see the result of simply collecting and graphing the data returned by the /info API endpoint.
The list of statistics collected and graphed:
- Total Votes
- Total Questions
- Total Answers
- Total Comments
- Total Accepted
- Accepted Percentage
- Total Users
- Total Badges
All per minute stats shown in Grafana are calculated by applying time function transformations to the total counts.
Multi Site Support
The configuration accepts a list of sites to poll. The hosted instance has the following sites available:
- stackoverflow.com
- serverfault.com
- superuser.com
- gaming.stackexchange.com
- askubuntu.com
- math.stackexchange.com
- apple.stackexchange.com
- 3dprinting.stackexchange.com
Download
The script source can be found on GitHub.
Following in the path of Stack Exchange, this is published under the MIT License.
Requirements
The application is built in Node.js and outputs data in the carbon plaintext protocol.
This applications requires an instance of carbon-cache or equivalent metric storage engine to properly store stats; in addition, it requires a front end viewer - in this example, I am using graphite-web and Grafana.
Configuration & Usage
To configure the application, simply copy config.sample.js to config.js and adjust your desired parameters.
To start the application, simply run the main file with node.
cd $APP_HOME
node stackstats.js &>> log &
Contact
Created by:
Matthew Clark
[email protected]
Update 9/13/18Sorry, the domain name expired for some time there, but I never stopped collecting metrics! I have updated the active link, metrics can again be viewed with one year of history.

