When viewing the Query Statistics graphs for an application, you have the option of choosing 'Week', 'Month', 'Year', or 'All Time'.
When hovering over 'week' it states "view stats for the last 7 days", 'month' states "view stats for the last 30 days".
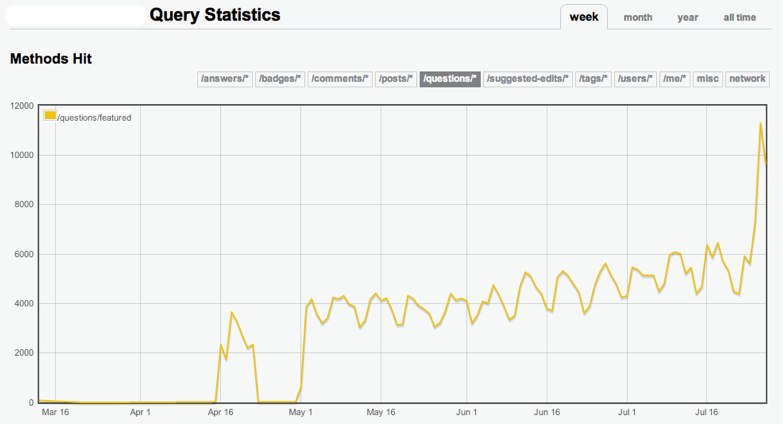
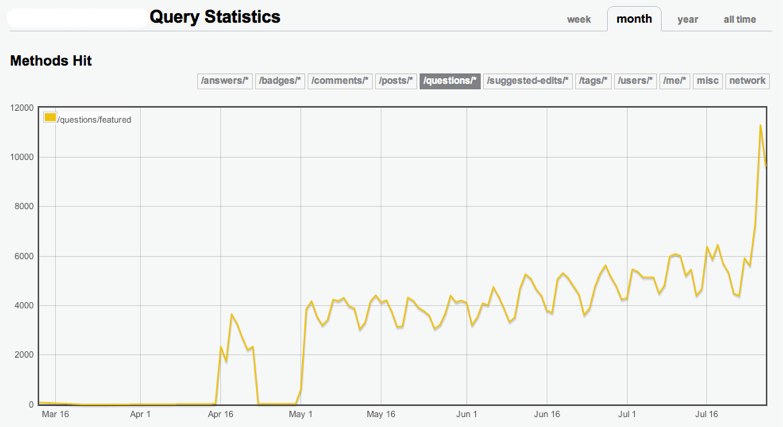
I've never been able to view less than 3 months at a time. As a matter of fact, the 'week' and 'month' tabs for my app appear to show the same information, no difference in granularity either.


The year tab appears correct.
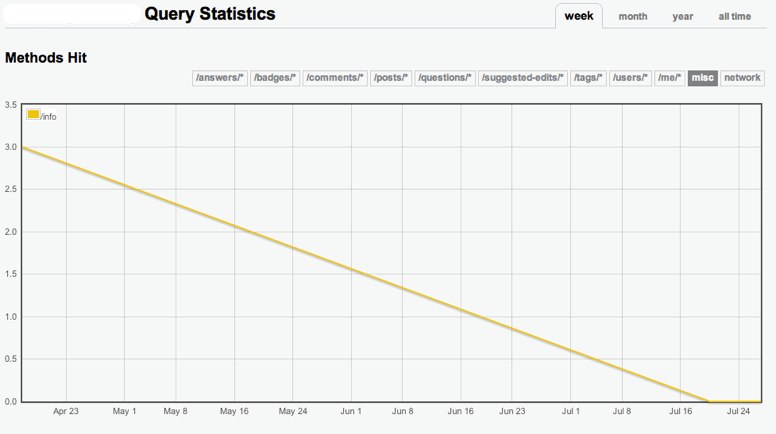
I may need to write this up as a separate issue, but X-axis labels may also sometimes just be wrong. Consider this graph of the misc queries by week:

Half a query?

